Functionality Pack
Reporting & Analytics
Leverage the advantages of a single unified platform to get your project data working for you
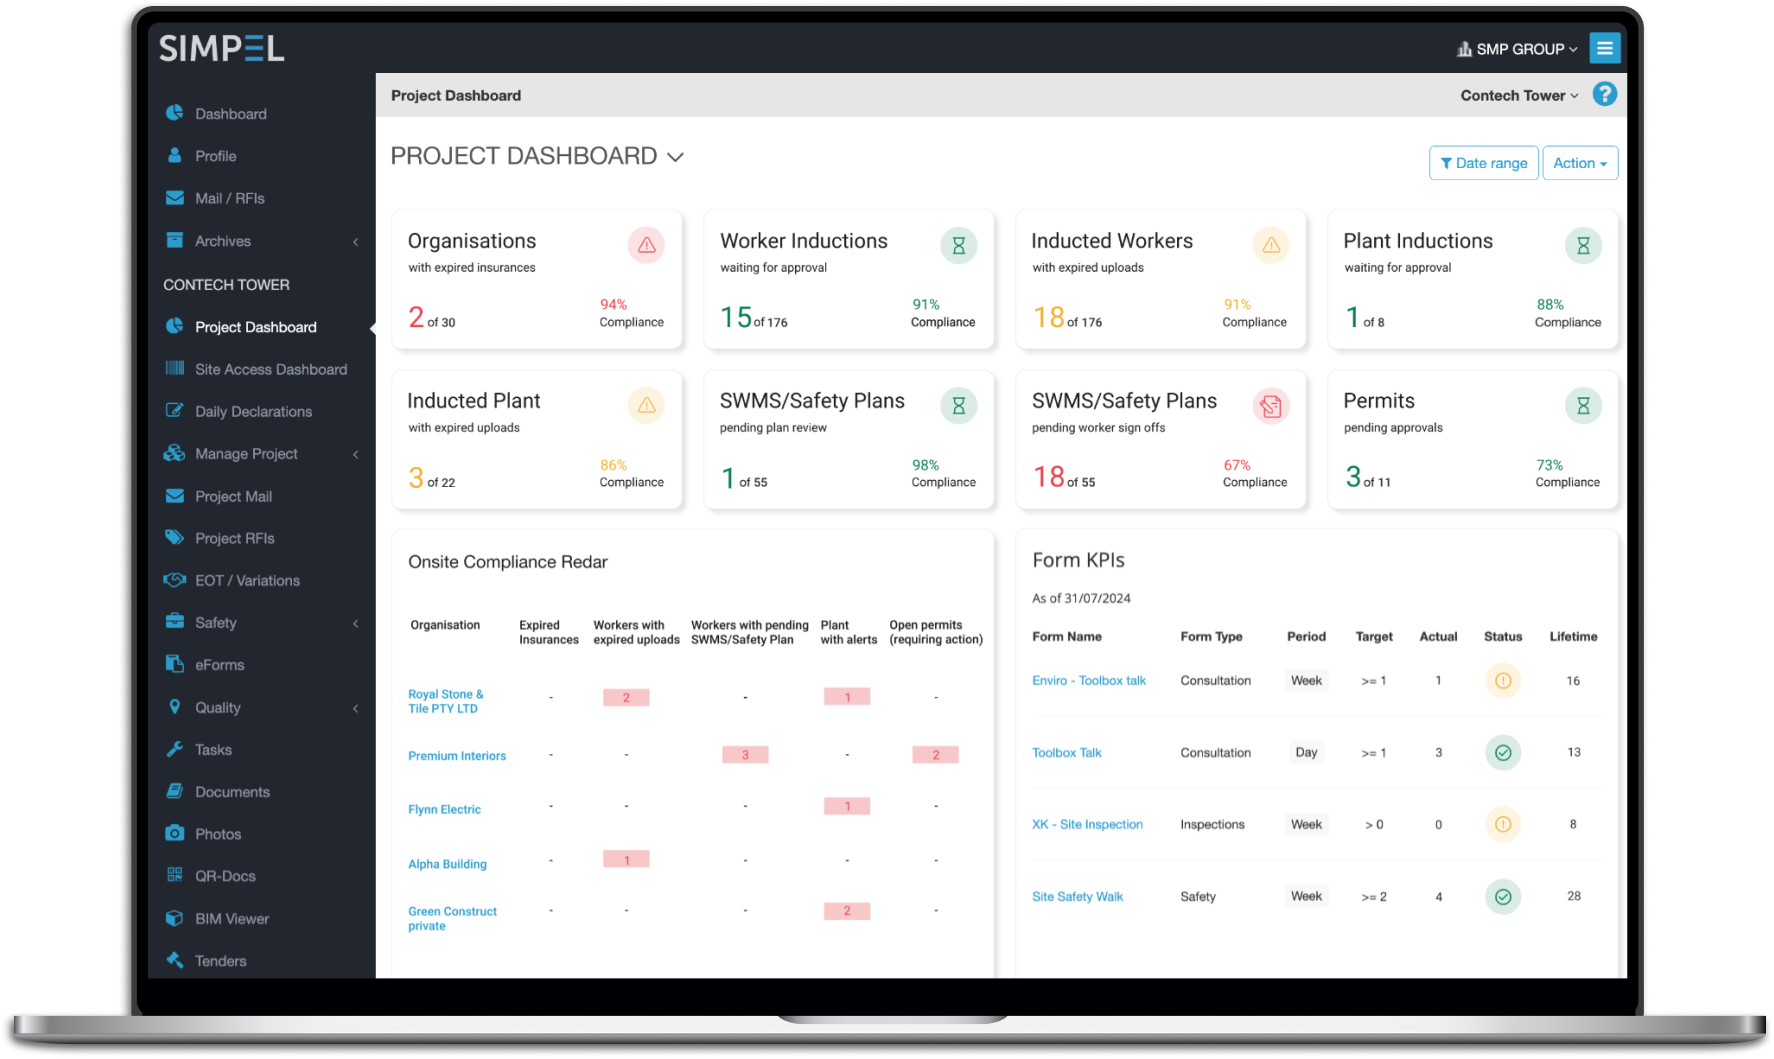
Connected, real-time data at your fingertips
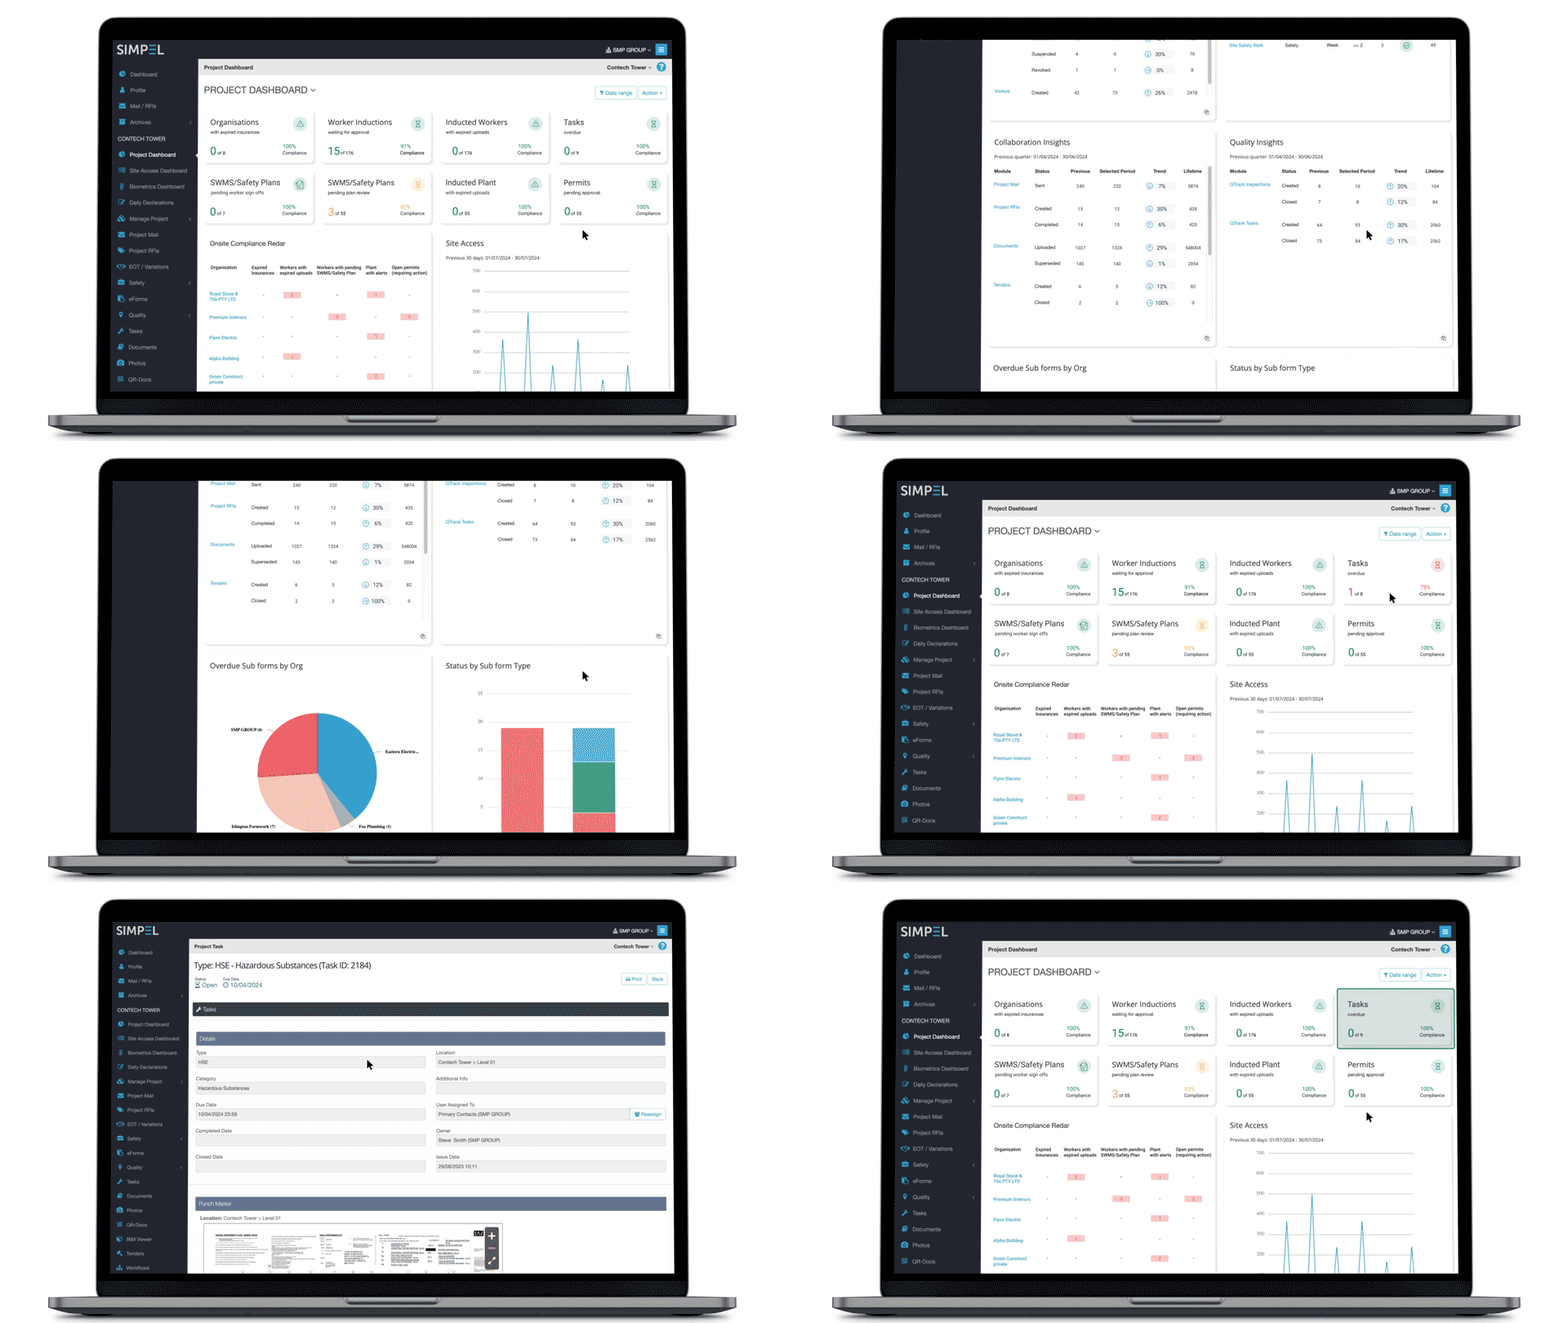
Whether you're using one module or many, your data in Simpel is real-time and can be analysed any time. Put it to use to gain valuable operational insights and guide your business operations.
Features
- View project data in real-time
- Prioritise and action items directly from the dashboard to facilitate effortless workflows
- View metrics for selected time periods - whether it's a single day, week, month or the entire project lifecycle.
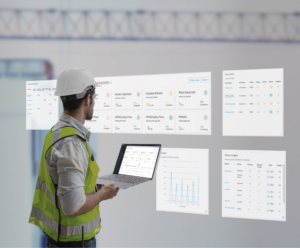
- Create customised dashboards for different teams
- Set compliance levels for each tracked metric or KPI
- Specify date ranges to meet reporting frequency
- Visualise data collected from key operational counts, work patterns and trends through a range of charts, trend lines and graphs
- Optional colour-coded indicators for each parameter
- Print dashboard widgets for reporting purposes
Features
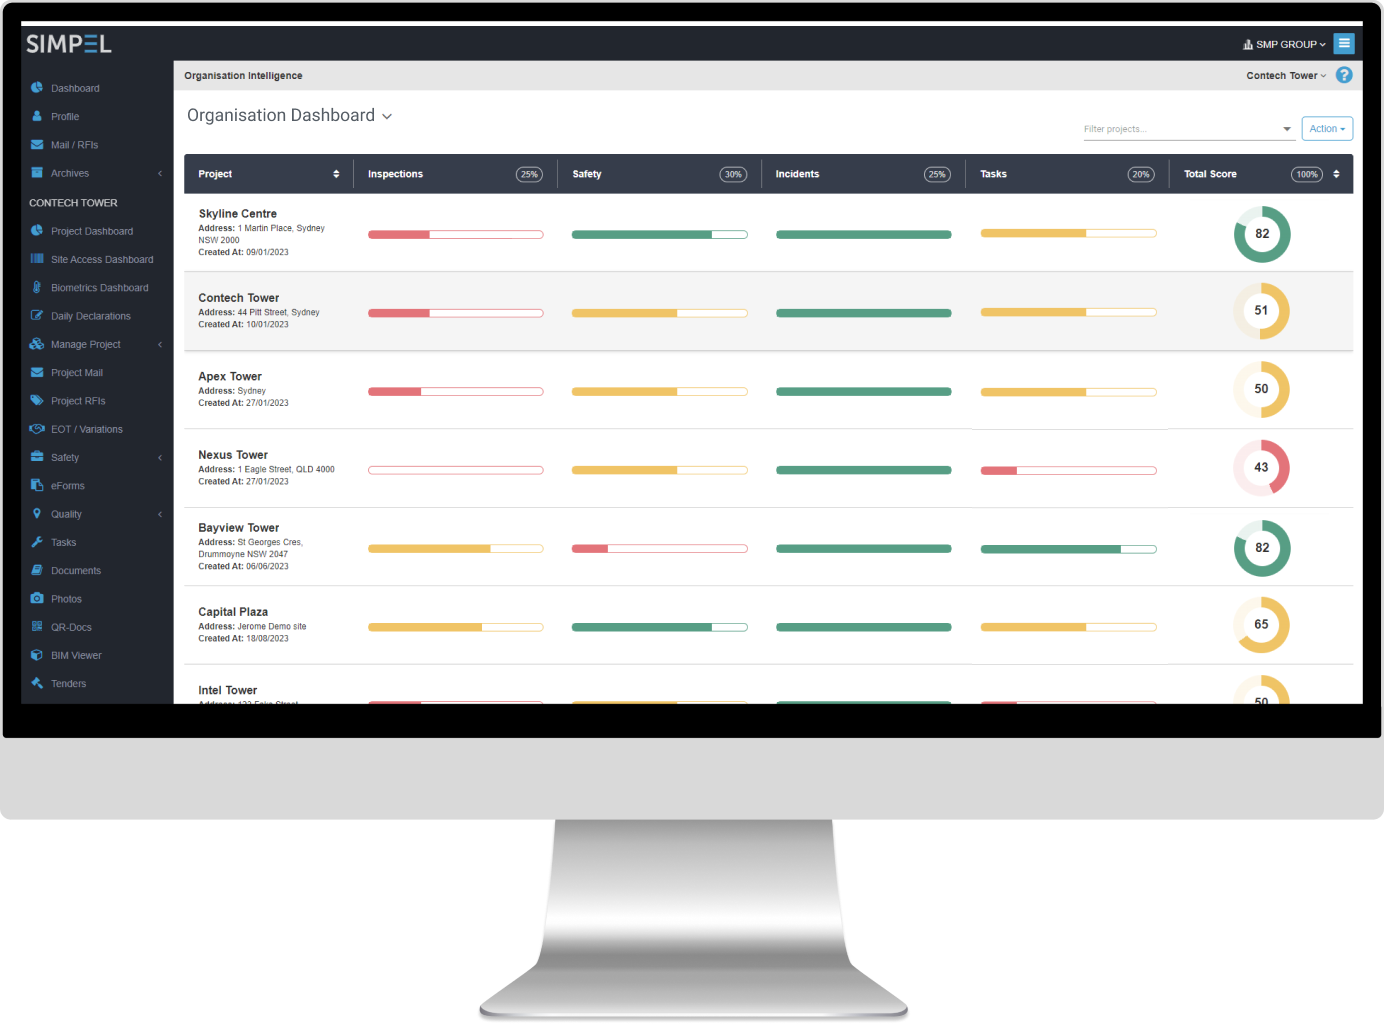
- Automate tracking and analysis of all your projects across a range of parameters
- Select metrics, and customise weighting and pass/fail criteria
- Colour coded indicators display project level pass/fail
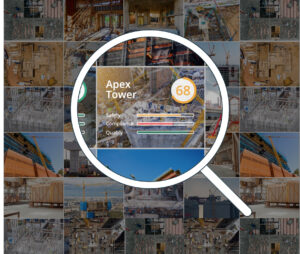
- Project-level health scores help teams standardise metrics being tracked and to easily monitor projects under management
- Also allows for side-by-side project comparisons across chosen metrics
Features
- Extract key real-time data across all modules instantly - no need to contact Simpel to request your data export
- Isolate data at the project, organisation, company or modular level
- Select the data set and export via CSV file
- Useful for internal or client reporting purposes
